Trending
Featured Articles
Filter by Categories or Explore All Our Articles Below.
- All

Swiss Giant Empira Secures $111M Goldman Sachs Loan for Miami’s Next Luxury High-Rise
Read more
Dania Perez
South Florida Real Estate: Balancing Safety Concerns with Market Growth in 2025
Read more
Dania Perez
Homestead-Miami Speedway in $536K Rent Dispute with City Officials Over Missed CPI Adjustments
Read more
Dania Perez
Riviera Beach Launches New Bid for Premier Waterfront Entertainment Complex
Read more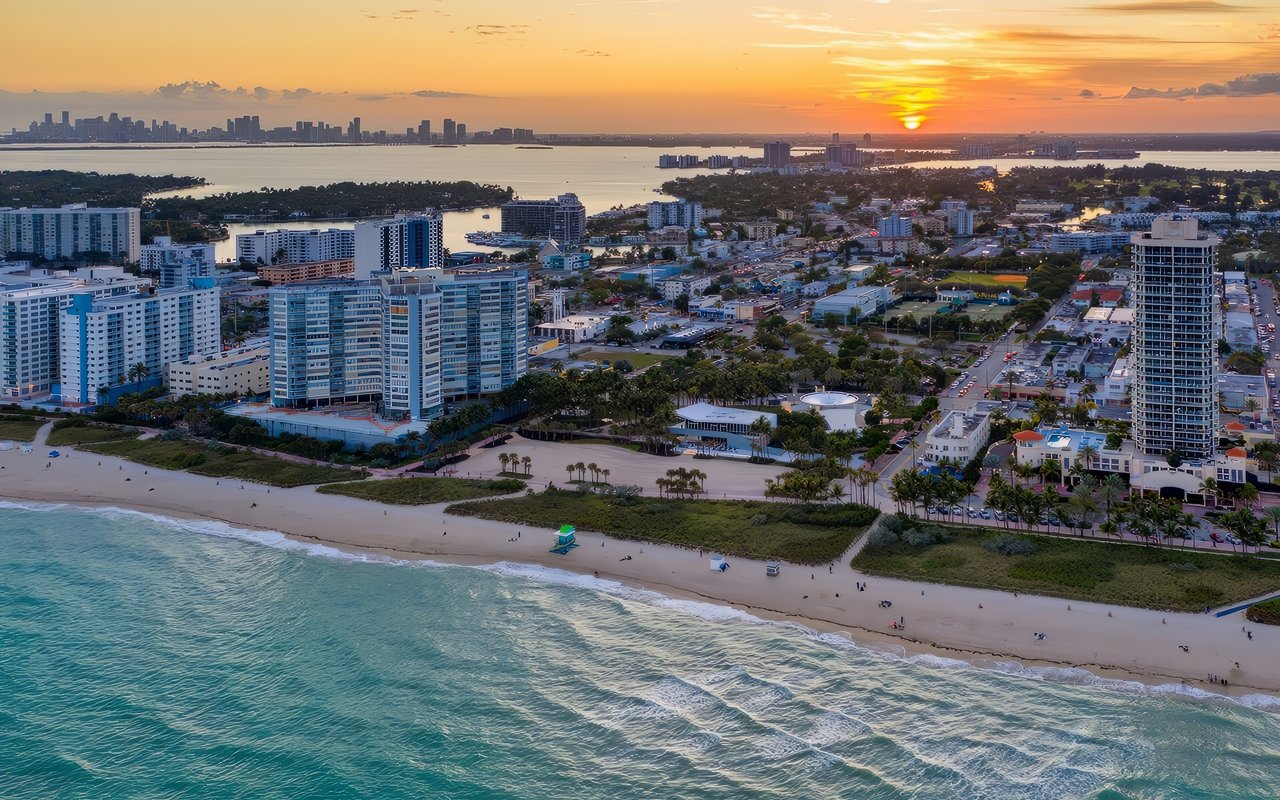
Dania Perez
Miami Beach’s North Beach Transformation: Rental-Friendly Luxury Condos Launch at $600K
Read more
Dania Perez